
Page 4 - Computers and Technology for Social Studies
P. 4
03-SS-Spreadsheet 5/31/07 8:34 AM Page 64
! Changing the number format of a cell does not ! When you create an embedded chart, the chart
affect the actual value stored there or used in cal- exists as an object in the worksheet alongside the
culations—it affects only the way in which that data.
value is displayed. ! All charts are linked to the data they plot. When
you change data in the plotted area of the work-
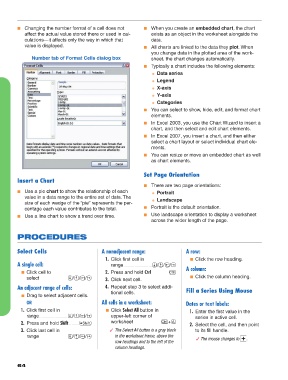
Number tab of Format Cells dialog box sheet, the chart changes automatically.
! Typically a chart includes the following elements:
" Data series
" Legend
" X-axis
" Y-axis
" Categories
! You can select to show, hide, edit, and format chart
elements.
! In Excel 2003, you use the Chart Wizard to insert a
chart, and then select and edit chart elements.
! In Excel 2007, you insert a chart, and then either
select a chart layout or select individual chart ele-
ments.
! You can resize or move an embedded chart as well
as chart elements.
Set Page Orientation
Insert a Chart
! There are two page orientations:
! Use a pie chart to show the relationship of each " Portrait
value in a data range to the entire set of data. The " Landscape
size of each wedge of the “pie” represents the per-
centage each value contributes to the total. ! Portrait is the default orientation.
! Use a line chart to show a trend over time. ! Use landscape orientation to display a worksheet
across the wider length of the page.
PROCEDURES
Select Cells A nonadjacent range: A row:
1. Click first cell in ! Click the row heading.
A single cell: range . . . . . . . . . . . . . . . . . . . . . . . . . . ˘/¯/≤/≥
! Click cell to 2. Press and hold Ctrl . . . . . . . . . . . . . . . . Ç A column:
select . . . . . . . . . . . . . . . . . . . . . . . . . . ˘/¯/≤/≥ 3. Click next cell. ! Click the column heading.
An adjacent range of cells: 4. Repeat step 3 to select addi-
tional cells. Fill a Series Using Mouse
! Drag to select adjacent cells.
OR All cells in a worksheet: Dates or text labels:
1. Click first cell in ! Click Select All button in 1. Enter the first value in the
range . . . . . . . . . . . . . . . . . . . . . . . . . . ˘/¯/≤/≥ upper-left corner of series in active cell.
2. Press and hold Shift. . . . . . . . . . Í worksheet. . . . . . . . . . . . . . . . . . . . . . . . . . Ç+A 2. Select the cell, and then point
3. Click last cell in # The Select All button is a gray block to its fill handle.
range . . . . . . . . . . . . . . . . . . . . . . . . . . ˘/¯/≤/≥ in the worksheet frame, above the # The mouse changes to .
row headings and to the left of the
column headings.
64